45 Years after the Santa Barbara Oil Spill, Looking at a Historic Disaster Through Technology

JANUARY 28, 2014 -- Forty-five years ago, on January 28, 1969, bubbles of black oil and gas began rising up out of the blue waters near Santa Barbara, Calif.
On that morning, Union Oil's new drilling rig Platform "A" had experienced a well blowout, and while spill responders were rushing to the scene of what would become a monumental oil spill and catalyzing moment in the environmental movement, the tools and technology available for dealing with this spill were quite different than today.
The groundwork was still being laid for the digital, scientific mapping and data management tools we now employ without second thought.
In 1969, many of the advances in this developing field were coming out of U.S. intelligence and military efforts during the Cold War, including a top-secret satellite reconnaissance project known as CORONA.
A decade later NOAA's first oil spill modeling software, the On-Scene Spill Model (OSSM) [PDF], was being written on the fly during the IXTOC I well blowout in the Gulf of Mexico in 1979. Geographic Information Systems (GIS) software didn’t begin to take root in university settings until the mid-1980s.
To show just how far this technology has come in the past 45 years, we've mapped the Santa Barbara oil spill in Southwest ERMA, NOAA's online environmental response mapping tool for coastal California. In this GIS tool, you can see:
- The very approximate extent of the oiling.
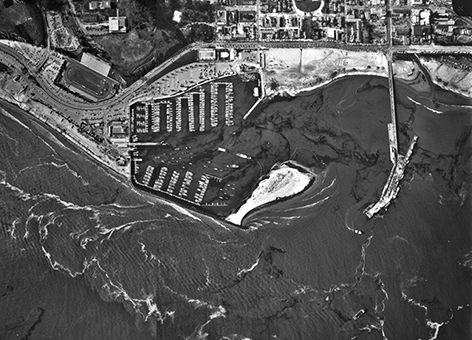
- The location and photos of the drilling platform and affected resources (e.g., Santa Barbara Harbor).
- The areas where seabirds historically congregate. Seabirds, particularly gulls and grebes, were especially hard hit by this oil spill, with nearly 3,700 birds confirmed dead and many more likely unaccounted for.
Even though the well would be capped after 11 days, a series of undersea faults opened up as a result of the blowout, continuing to release oil and gas until December 1969. As much as 4.2 million gallons of crude oil eventually gushed from both the well and the resulting faults. Oil from Platform "A" was found as far north as Pismo Beach and as far south as Mexico.

Nowadays, we can map the precise location of a wide variety of data using a tool like ERMA, including photos from aerial surveys of oil slicks along the flight path in which they were collected. The closest responders could come to this in 1969 was this list of aerial photos of oil and a printed chart with handwritten notes on the location of drilling platforms in Santa Barbara Channel.


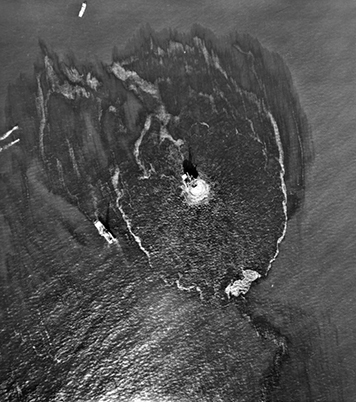
Yet, this oil spill was notable for its technology use in one surprising way. It was the first time a CIA spy plane had ever been used for non-defense related aerial photography. While classified information at the time, the CIA and the U.S. Geological Survey were actually partnering to use a Cold War spy plane to take aerial photos of the Santa Barbara spill (they used a U-2 plane because they could get the images more quickly than from the passing CORONA spy satellite). But that information wasn't declassified until the 1990s.
While one of the largest environmental disasters in U.S. waters, the legacy of the Santa Barbara oil spill is lasting and impressive and includes the creation of the National Environmental Policy Act, U.S. Environmental Protection Agency, and National Marine Sanctuaries system (which soon encompassed California’s nearby Channel Islands, which were affected by the Santa Barbara spill).
Another legacy is the pioneering work begun by long-time spill responder, Alan A. Allen, who started his career at the 1969 Santa Barbara oil spill. He became known as the scientist who disputed Union Oil's initial spill volume estimates by employing methods still used today by NOAA. Author Robert Easton documents Allen's efforts in the book, Black tide: the Santa Barbara oil spill and its consequences:
Others ... were questioning Union’s estimates. At General Research Corporation, a Santa Barbara firm, a young scientist who flew over the slick daily, Alan A. Allen, had become convinced that Union’s estimates of the escaping oil were about ten times too low. Allen’s estimates of oil-film thickness were based largely on the appearance of the slick from the air. Oil that had the characteristic dark color of crude oil was, he felt confident from studying records of other slicks, on the order of one thousandth of an inch or greater in thickness. Thinner oil would take on a dull gray or brown appearance, becoming iridescent around one hundred thousandth of an inch. Allen analyzed the slick in terms of thickness, area, and rate of growth. By comparing his data with previous slicks of known spillage, and considering the many factors that control the ultimate fate of oil on seawater, he estimated that leakage during the first days of the Santa Barbara spill could be conservatively estimated to be at least 5,000 barrels (210,000 gallons) per day.
And in a lesson that history repeats itself: Platform "A" leaked 1,130 gallons of crude oil into Santa Barbara Channel in 2008. Our office modeled the path of the oil slicks that resulted. Learn more about how NOAA responds to oil spills today.

